Repository navigation
Add cluster remote client so11y metrics - #14245
Conversation


UI screenshots (local verification)Grafana cluster
Grafana instance
Horizon OAP so11y
|
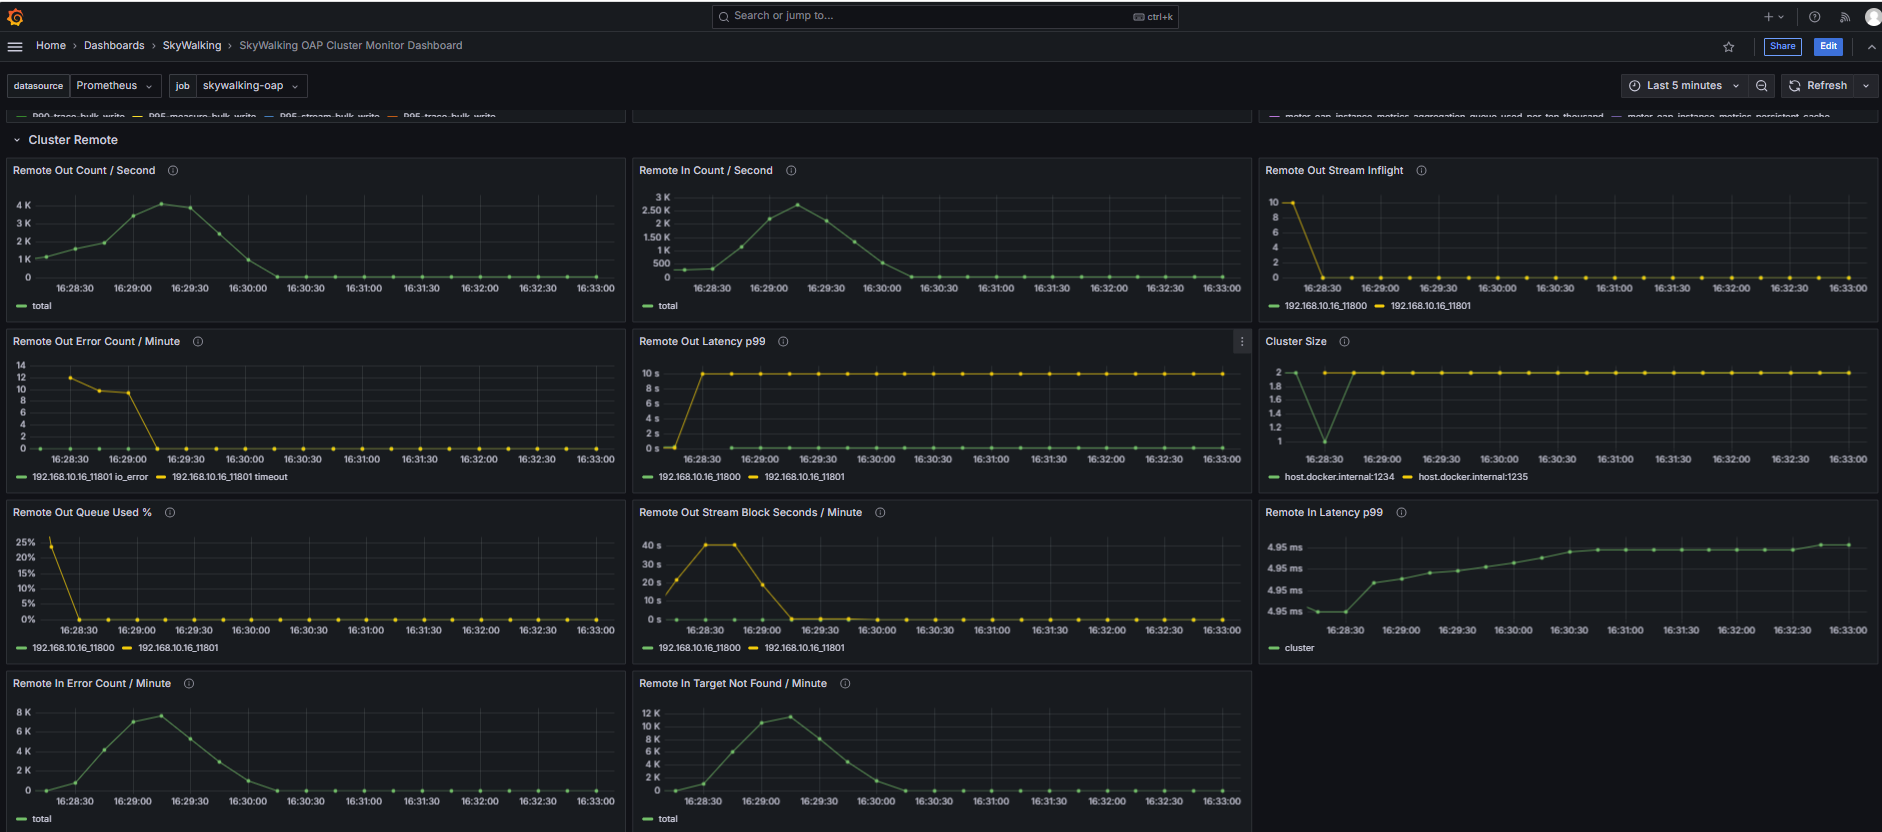
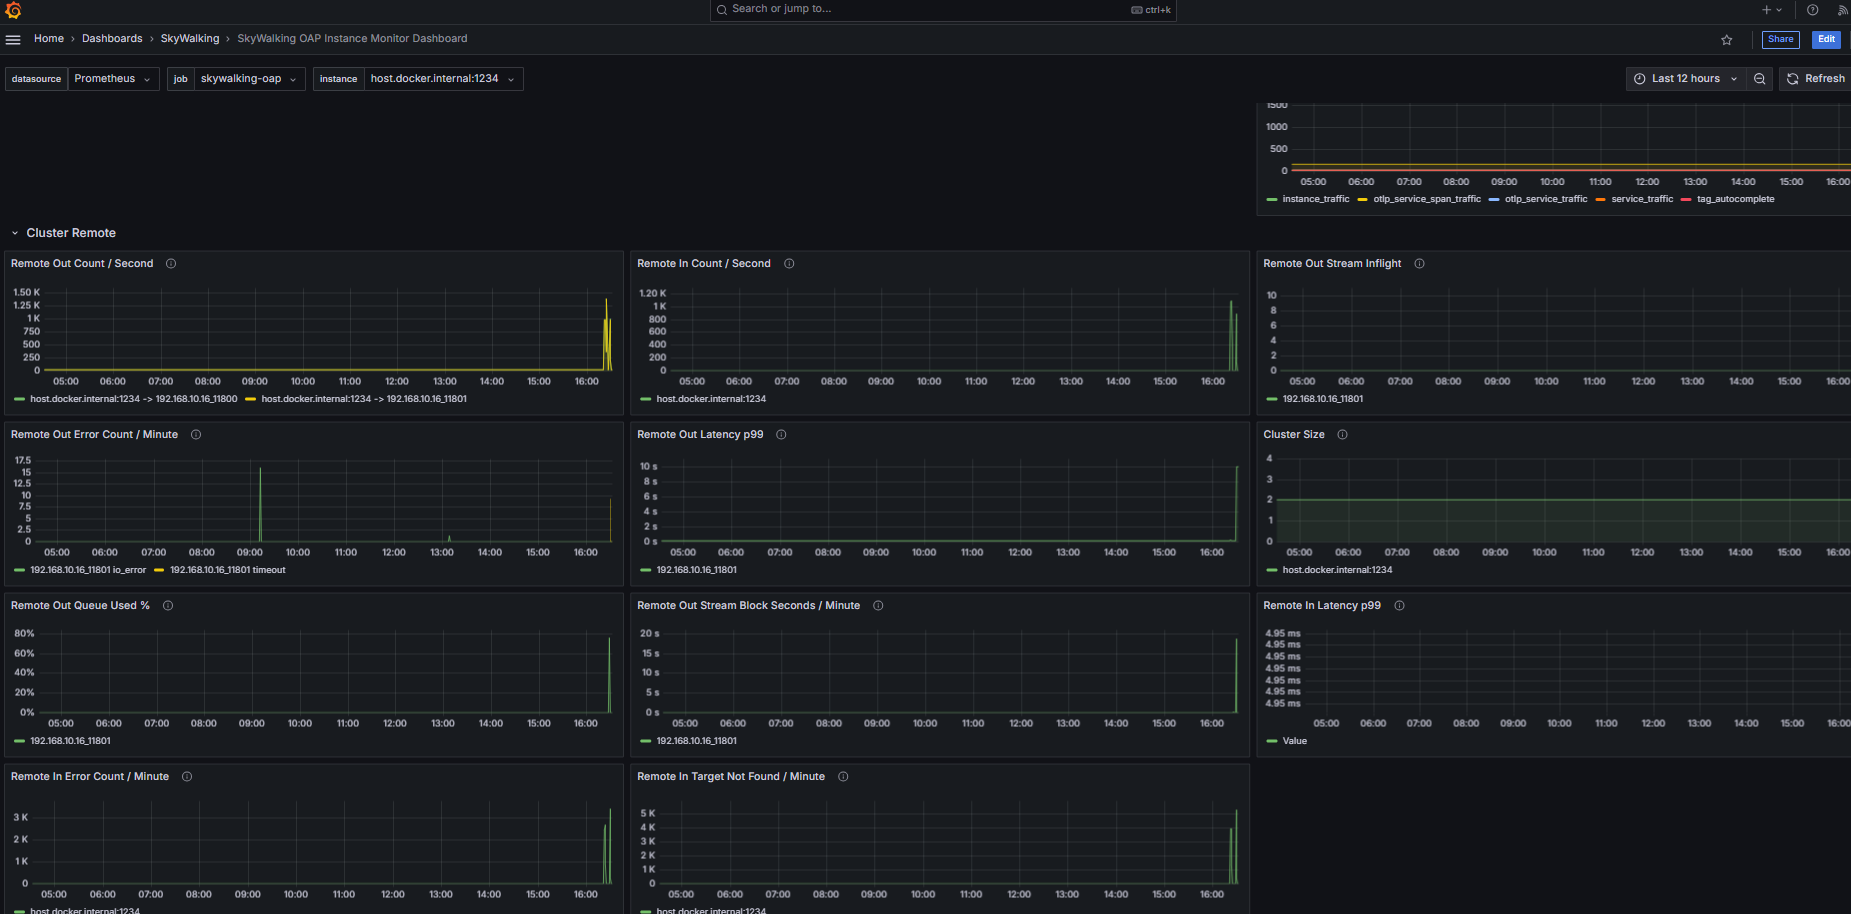
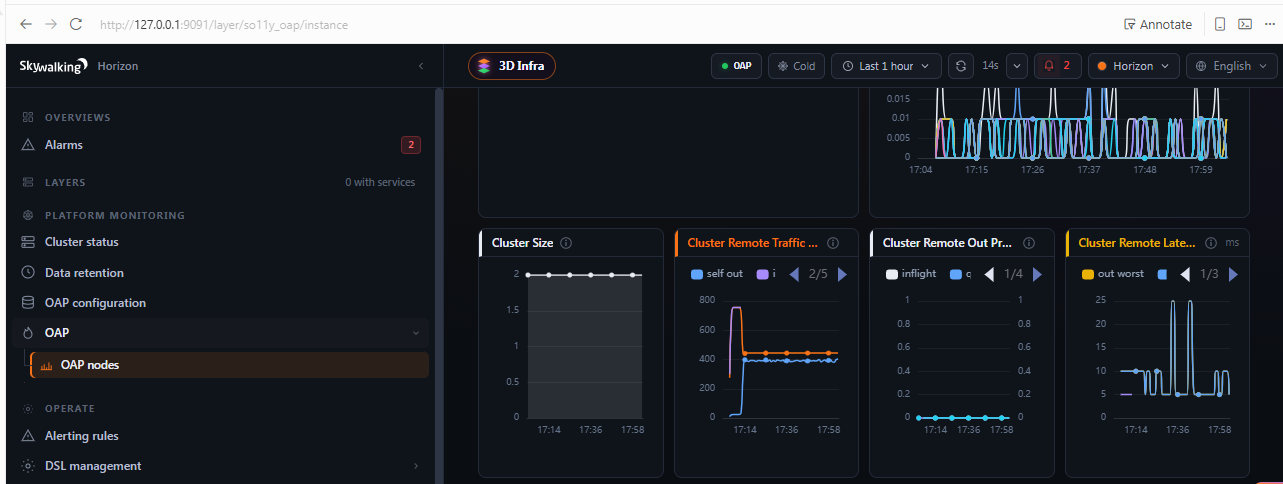

808c1e0 to
9736715
Compare

 wu-sheng
left a comment
wu-sheng
left a comment
There was a problem hiding this comment.
Thanks for this. Getting the cluster metrics into the so11y MAL rules and dashboards is a useful addition. Three points:
1. Please drop the reason label from remote_out_error_count.
Every failure behind those reasons is already logged with its exception, and the exception carries the gRPC status: onError logs each failed stream at ERROR (RESOURCE_EXHAUSTED at WARN, once per 120s), and the consume catch, the interrupted slot wait and the self client all log at ERROR. Deployments keep OAP's error logs, so the metric only needs to show that pushes to a peer are failing and how often; the logs say why.
Keeping remote_out_error_count{dest, self} as it is today also avoids changing the label set of an existing metric, and avoids pre-creating 8 series per client. Some values also don't fit this link: auth_failed can never fire, because RemoteServiceHandler is registered without an authentication interceptor, and rate_limited / rejected don't describe what RESOURCE_EXHAUSTED / CANCELLED mean.
This touches RemoteClientMetrics (the reason constants, reasonOf, the pre-created counters), RemoteClientMetricsTest, oap.yaml, oap.data.yaml, dashboards-so11y.md and the two Grafana JSON files. The Horizon UI PR (apache/skywalking-horizon-ui#222) already sums by dest only, so it is unaffected.
2. Please keep counting errors in onError.
On master, onError logs async failures but never increments remote_out_error_count, so deadline-exceeded and unavailable peers, the most common real failures, never reach the metric. Counting them there (without a reason) is a real fix.
3. Changelog and PR description wording.
remote_in_count, remote_in_error_count, remote_in_target_not_found_count, remote_in_latency, remote_out_count, remote_out_error_count and cluster_size have been exported on the Prometheus endpoint since #2133, and the Grafana dashboards already chart the remote in/out counts. What this PR adds is getting them into the so11y MAL rules and dashboard, plus the new client metrics. Suggested changelog line:
* Add the existing cluster remote metrics (remote in/out counts, errors, in latency, and cluster size) to the OAP self-observability MAL rules and dashboards, add remote client out latency, in-flight streams, stream-slot wait time and send-queue usage metrics, and count asynchronous gRPC send failures in `remote_out_error_count`, which were only logged before.
|
Thanks for the review. Addressed all three points:
Fork CI is green after the change: Pushed to this PR branch as 159b2cb. |
159b2cb to
3fc6ea5
Compare

3fc6ea5 to
8c9a271
Compare

|
Thanks for the quick update. I pushed a follow-up directly to this branch and squashed the branch into one commit (you stay the author), so please save any local work before resetting your local branch to the new head. What changed and why:
Checked locally on the pushed commit: the remote client and handler unit tests, the full unit-test suite, checkstyle, and javadoc on JDK 11. |


Expose the cluster remote metrics OAP already exports on its Prometheus
endpoint (remote_in_*, remote_out_count, remote_out_error_count and
cluster_size) through the OAP self-observability MAL rules and the so11y
dashboard docs, and chart them on the Grafana cluster and instance
dashboards, which so far only had the remote in/out count panels.

Add remote client metrics: remote_out_latency (one sample per
successful batch stream for peers until the client is closed, per
successful push for the self client), remote_out_stream_inflight,
remote_out_stream_block_seconds and remote_out_queue_used_percentage.
The queue gauge is sampled on the consumer side, after each batch and
while waiting for a stream slot, not on the push path that every metric
sent to a peer takes.

remote_out_error_count keeps its dest and self labels. It now also
counts refused enqueues, interrupted stream-slot waits and asynchronous
stream failures reported through onError, none of which were counted
before. Cancelled streams and streams failed by close() shutting the
channel are not counted; failures while a removed peer's queue drains
are counted and logged.

On the receiving side, an exception from the target worker now discards
only that message and counts remote_in_error_count, instead of failing
the whole stream. The log line names the worker rather than printing
the message.
8c9a271 to
881ba33
Compare
|
Thanks for the detailed follow-up and for landing it on this branch (and for keeping me as author after the squash). — I'll reset locally and review the new head |


Summary
Add the existing cluster remote metrics (remote in/out counts, errors, in latency, and cluster size) to the OAP self-observability MAL rules and dashboards, add remote client out latency, in-flight streams, stream-slot wait time and send-queue usage metrics, and count asynchronous gRPC send failures in
remote_out_error_count, which were only logged before.Companion Horizon UI: apache/skywalking-horizon-ui#222
Test plan
GRPCRemoteClient/RemoteClientMetrics/SelfRemoteClientFork CI
reason, keeponErrorcounting): WIP: drop remote_out_error reason labels (review) songzhendong/skywalking#36